


MAPS
The proposed system uses GoogleEarth to map counts and releases of different dog types across the city with percentages and population estimates displayed using a grid with adjustable spacing.
Open the "ABCdatabase_SmartPhone_demo.mdb" database in the SmartPhone_files folder.
1) Select "go to Maps" from the Main Switchboard and then "map dogs counted or released".
2) Set the period over which the dogs counted and/or released are to be displayed by selecting its duration (defaulted to 12 months) and final date (defaulted to today).
3) Select the type or types of dogs to be mapped and in the case of ear-notched dogs those seen on transit (or survey) or those released over the period.
4) Click "Make KML file". The total number of dogs counted and/or released is shown and if you click "OK" the Google Earth program will show the dogs as colour-coded icons against the aerial image of the city.
5) Change the selection, click "Make KML file" again, open Google Earth from the taskbar and click "Yes" to reload the kml file. Elect to discard unsaved items when closing Google Earth
The "map dogs counts or percentages" option will calculate total transit counts of the dog types selected at the left within grid cells with adjustable width and height (default 1000m x 1000m). Optionally the number of ear-notched females or males or females plus males can be displayed. If the checkbox at the centre of the dialog is checked the total of dog types selected at the left can be displayed as percentages of the total selected at the right. Examples might be the percentage of dogs that are female, the percentage of female dogs that are spayed, the percentage of unspayed females that are lactating etc. Empty cells are those for which the total selected at the right is less than the specified minimum sample size.
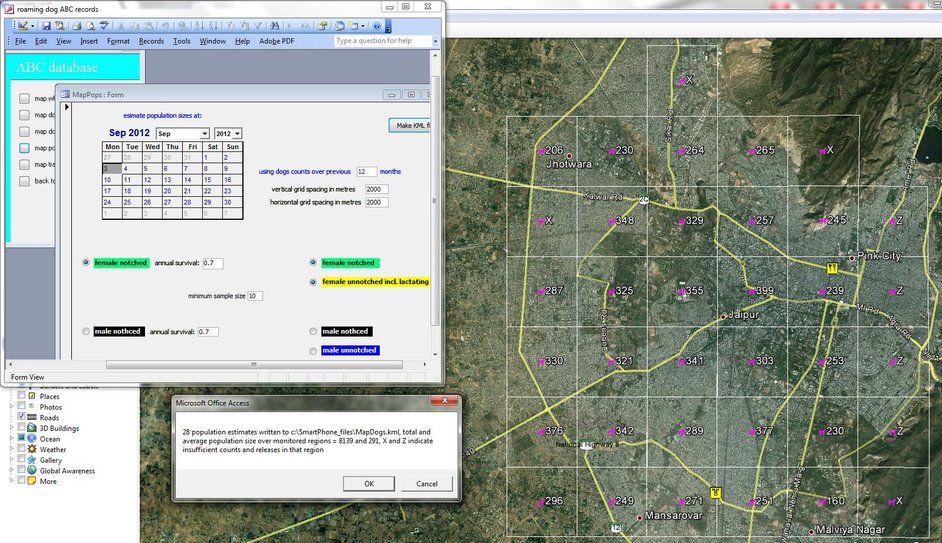
The "map population estimates" option calculates estimated numbers of roaming females or males or females plus males using either estimated numbers of notched females or males or females plus males. The total number or the number of unsterilized roaming dogs can be estimated. The estimates of roaming dog numbers are based on estimates of surviving ear-notched dogs which are calculated using the release locations and the survival rates in the text boxes. The main objective of the ear tattoos is to update those survival rate estimates. Roaming dog numbers are estimated only in those grid squares with the specified minimum number of observations required to estimate the current percentage of ear-notched dogs so the included squares depend on grid spacing and the specified period over which the dog counts are accumulated. Before the map is displayed the total and average number of roaming dogs (of the type/s selected) over the included squares are output.
The "map trajectory estimates" option calculates the change over time in the total number of roaming dogs within a set of grid squares that have each accumulated enough observations. The total is calculated at the selected end date and at preceding intervals equal to the duration of the specified period for accumulating counts (default 12 months). The included squares are those having the specified minimum number of observations required to estimate the percentage of ear-notched dogs in each period since the specified start date (defaulted to the date of the first recorded transit observations). So if the start date is left at the default only those squares with sufficient observations since the start of the intervention will be included, a later start date will include regions in which the intervention started more recently. The totals are written to a csv file which will open in Excel for plotting the trajectory, the included squares are displayed on the Google Earth map.


CONSERVATION RESEARCH LTD
Copyright © All Rights Reserved